DSO Financial Reporting: From Chaos to Clarity
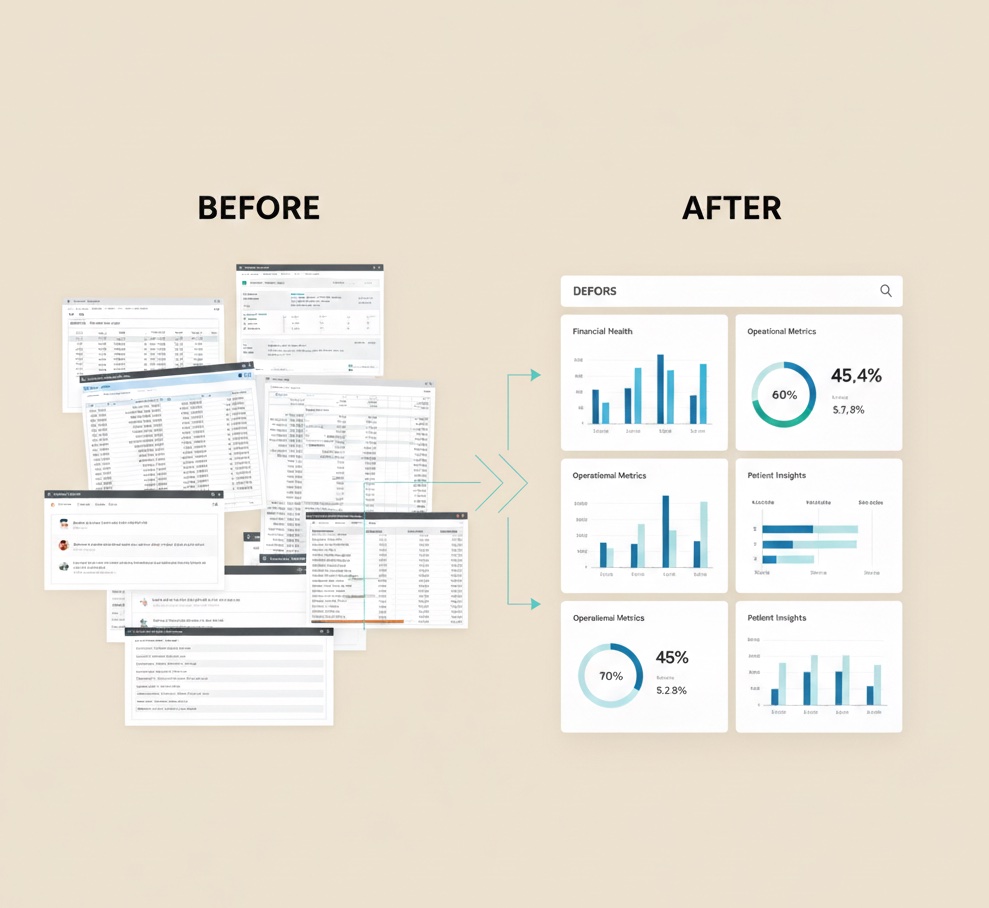
Fifty locations generating fifty different reports in fifty different formats. No way to compare, aggregate, or act. This is DSO financial reporting before standardization.
📚 Part of our DSO series: This article is part of The DSO Financial Operations Playbook, our comprehensive guide to building scalable financial operations across multiple dental practice locations.
The DSO Reporting Challenge
Single-practice financial reporting is straightforward. One location, one PMS, one set of books, one report. The owner reviews it and knows exactly what it means.
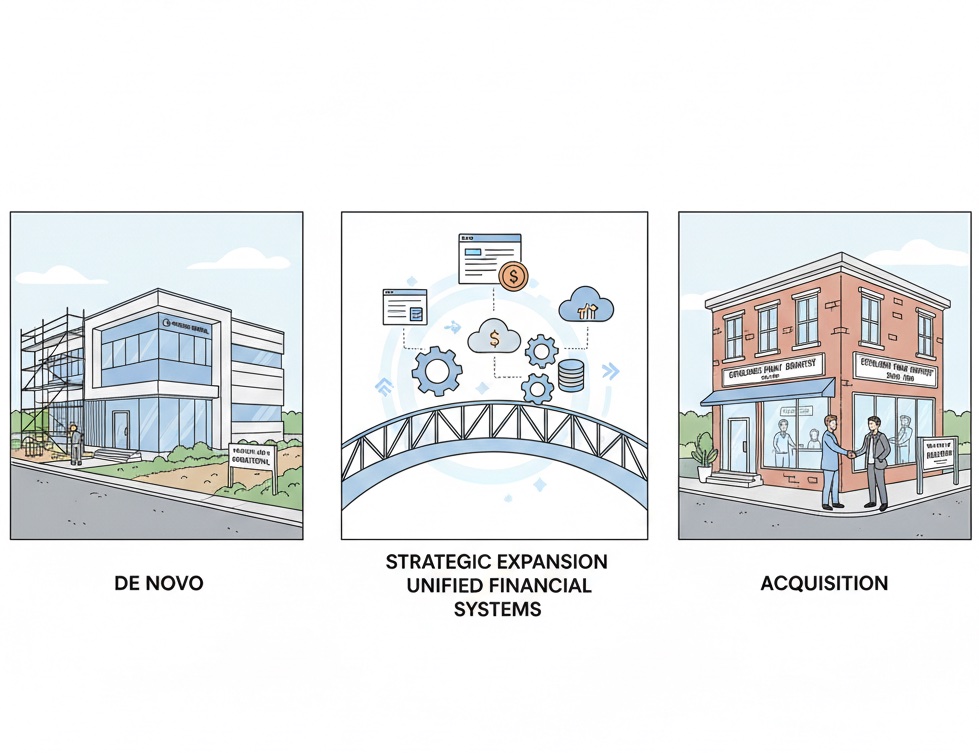
DSO financial reporting is exponentially more complex. Multiple locations may use different practice management systems. Each location may have developed its own reporting approach. Data definitions may vary making comparison meaningless. Aggregation may be manual and error-prone. By the time reports reach executives, they may be outdated.
The goal is transforming this chaos into clarity through systematic reporting that provides timely, accurate, comparable information across the entire portfolio.
Building the Reporting Foundation
Data standardization must happen before meaningful reporting is possible. Every location must measure the same things the same way. Production must use consistent definitions across locations. Collections must categorize by the same payment types. Adjustments must use the same reason codes. All metrics must calculate using the same formulas.
This standardization may require PMS configuration changes, staff training on consistent data entry, and ongoing monitoring for compliance. Without it, reports may look comparable but actually compare apples to oranges.
Data collection must be systematic and reliable. Manual data collection does not scale because it consumes staff time, introduces transcription errors, and creates delays. Automated data extraction from PMS databases provides more timely and accurate collection. Integration with accounting systems ensures financial data flows properly. Bank feeds provide independent verification of reported numbers.
Data validation catches problems before they become report errors. Reasonableness checks flag outliers that may indicate data problems. Cross-checks verify that related numbers reconcile. Trend analysis identifies sudden changes that warrant investigation.
The Reporting Hierarchy
DSO reporting serves different audiences with different needs at different frequencies.
Location-level reporting serves office managers who need daily operational visibility. Daily reports should show production and collections for the day, how the day compares to schedule and goals, any exceptions requiring attention, and key operational metrics.
Regional-level reporting serves regional managers who need to oversee multiple locations. Weekly reports should show each location's performance for the week, comparison across locations in the region, exceptions and issues requiring attention, and trends across the portfolio.
Executive-level reporting serves DSO leadership who need portfolio-wide visibility. Monthly reports should show consolidated financial performance, comparison to budget and prior periods, key performance indicators across the portfolio, and strategic metrics for decision-making.
Board-level reporting serves governance and investors who need summary visibility. Quarterly reports should show financial results with trend analysis, key strategic metrics, comparison to investment thesis, and forward-looking indicators.
Essential DSO Metrics
Revenue metrics should track production per location, collection rate, revenue per patient, revenue per provider, and revenue mix by service category.
Operational metrics should track patient volume, new patients, case acceptance rate, schedule utilization, and cancellation and no-show rate.
Financial metrics should track gross and net collection rate, accounts receivable days, overhead ratio, EBITDA by location, and cash flow.
Quality metrics should track reconciliation variance rate, days to close books, audit findings, and compliance metrics.
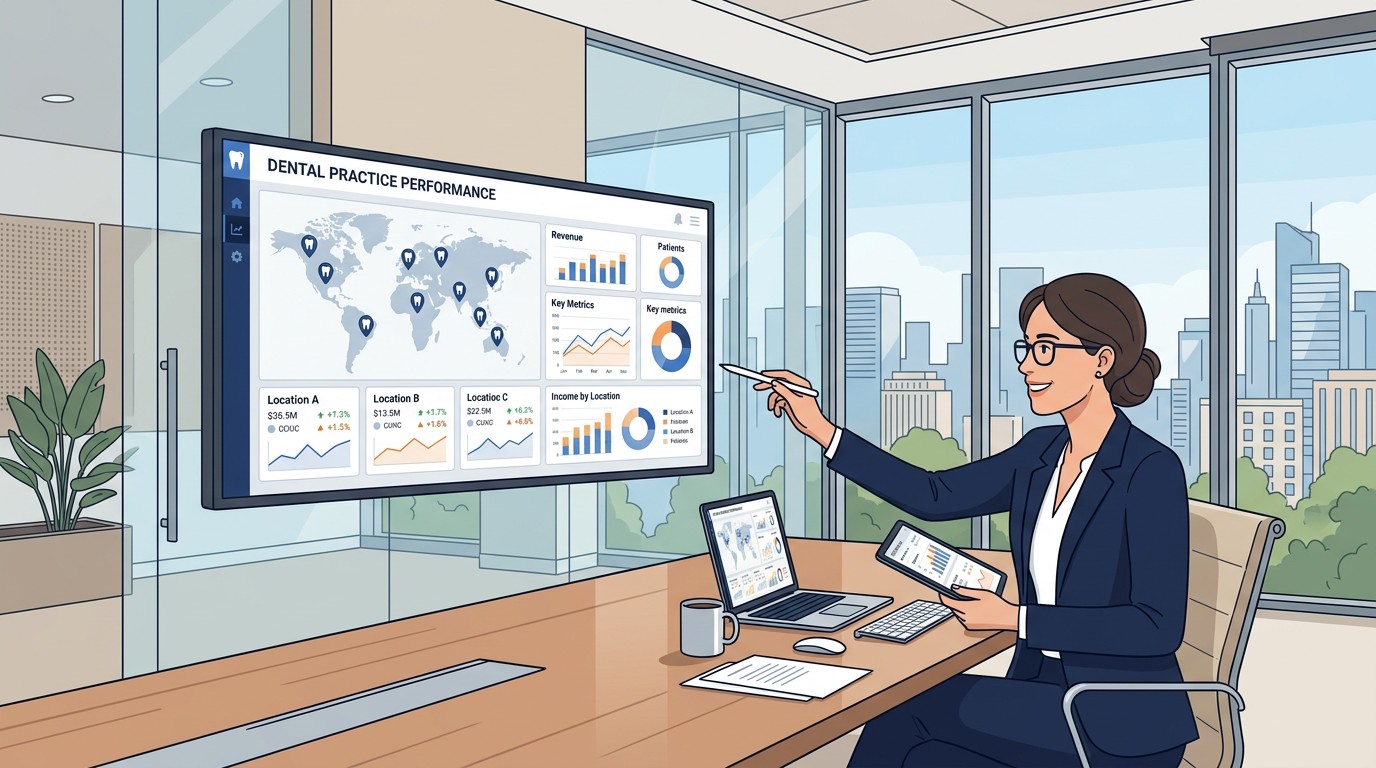
Dashboard Design
Effective dashboards show the right information to the right audience at the right time. Executive dashboards should show portfolio-wide KPIs at a glance, location performance comparison, exception flags for attention, and trend indicators.
Good dashboard design follows key principles. Lead with the most important metrics rather than burying them. Use consistent visualization so users learn to read quickly. Enable drill-down from summary to detail. Show trends rather than just point-in-time values. Highlight exceptions rather than just displaying all data.
Reporting Technology
The technology stack should enable rather than constrain reporting. Data warehouse architecture centralizes data from multiple sources, enables complex analysis, and supports historical trending. Business intelligence tools create visualizations, enable self-service exploration, and distribute reports automatically. Integration platforms connect PMS systems, accounting software, banking systems, and other data sources.
Build versus buy decisions depend on scale, complexity, and internal capability. Smaller DSOs may use spreadsheets and manual processes. Growing DSOs often adopt BI platforms like Tableau or Power BI. Large DSOs may build custom data warehouses and reporting applications.
Common Reporting Failures
Data quality issues make reports untrustworthy. When users do not trust the numbers, they ignore reports entirely or waste time validating manually. Prevention requires data validation at collection, investigation of anomalies, and continuous quality monitoring.
Timing delays make reports less useful. Reports that arrive two weeks after month-end have limited decision value. Prevention requires automation, streamlined workflows, and realistic expectations.
Metric overload makes reports confusing. Too many metrics obscure what matters. Prevention requires focusing on key performance indicators, layering detail behind summary, and resisting the urge to add metrics without removing others.
Lack of context makes reports hard to interpret. Numbers without comparison points or trends are just numbers. Prevention requires always showing comparison to goal, prior period, or peer benchmark.
Building Reporting Capability
Phase one establishes foundation by standardizing definitions across locations, implementing data collection from all sources, and building basic location and consolidated reporting.
Phase two expands capability by adding regional and executive dashboards, implementing trend analysis and benchmarking, and enabling self-service reporting for managers.
Phase three optimizes by adding predictive analytics and forecasting, implementing real-time or near-real-time reporting, and integrating reporting with operational workflows.
Building DSO financial reporting? Zeldent provides the reconciliation foundation that ensures your reported numbers match reality. Automated daily matching between PMS and bank data means your reports reflect verified transactions. Schedule a demo to see DSO-scale reconciliation.